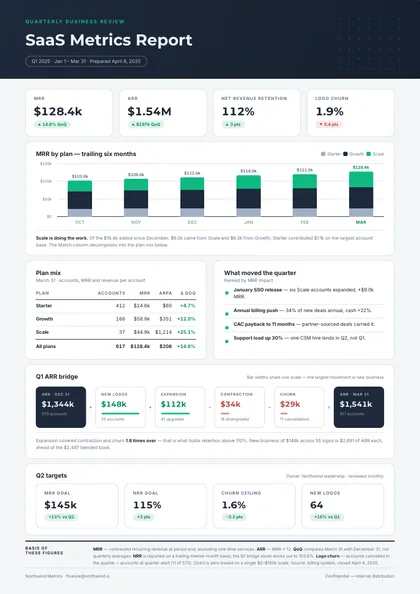
Card-grid dashboard · Slate & emerald · Montserrat + Inter
expressive A4 portrait 1 page
See the full document
Use this template
Reports
A SaaS metrics pack puts ARR, net revenue retention, churn and pipeline in one place, with the cards and charts sized so a board can scan them cold.
3 designs, each a separate take on the same document rather than a recolour of one layout: Card-grid dashboard, Minimal, type-led and Side rail. Every preview below is the actual compiled output, not a mock-up.
Open one in the editor and render it from your own JSON over the API — 1 page of A4 portrait, the same engine either way.
Generating these from your own data? See how reports render over the API Card-grid dashboard · Slate & emerald · Montserrat + Inter
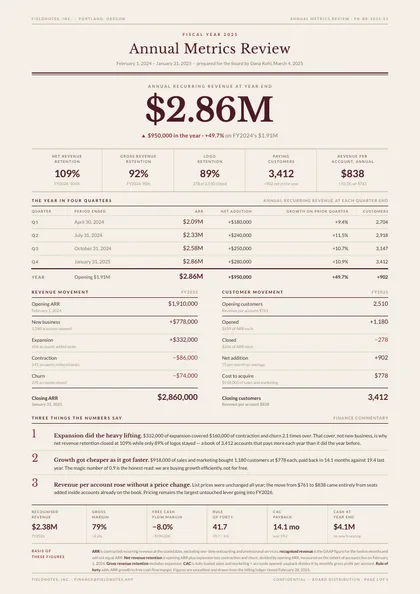
Minimal, type-led · Oxblood & bone · Libre Baskerville + Lato
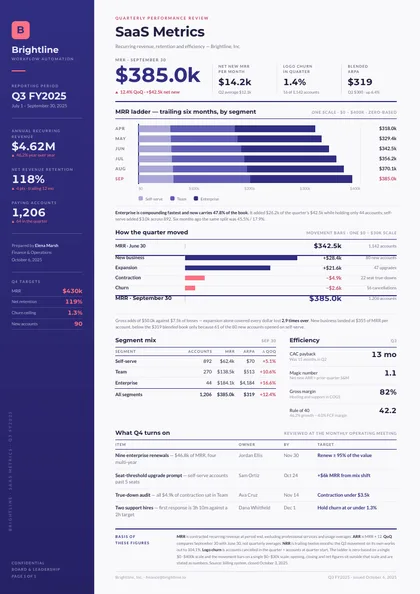
Side rail · Indigo & coral · Montserrat + Lato
Same document, same data model, 3 different arguments about how it should look on paper. Pick on layout and typography — the content behaves identically.
| Design | Layout | Palette | Typefaces | Pages |
|---|---|---|---|---|
| Emerald Dashboard | Card-grid dashboard | Slate & emerald | Montserrat + Inter | 1 · A4 portrait |
| Figure Almanac | Minimal, type-led | Oxblood & bone | Libre Baskerville + Lato | 1 · A4 portrait |
| Ladder Rail | Side rail | Indigo & coral | Montserrat + Lato | 1 · A4 portrait |
Each design is authored against an explicit reflow contract, so it is defined up front which blocks are emitted once per record and which fields absorb longer content. That is what stops the layout falling apart at a hundred rows.
| Design | Repeats per record | Grows with your data |
|---|---|---|
| Emerald Dashboard | KPI cards; stacked chart columns; plan-mix rows; ARR bridge steps; Q2 target cards | the panel captions; "what moved" notes; the basis-of-figures note |
| Figure Almanac | quarter rows; revenue-movement rows; customer-movement rows; the three numbered observations; efficiency figures | each numbered observation's sentence; the basis-of-figures paragraph |
| Ladder Rail | ladder rows (one per month); movement ledger rows; segment table rows; efficiency rows; Q4 watchlist rows | the two panel captions; each watchlist target cell; the basis-of-figures paragraph |
These document sets each include the SaaS metrics report designs above.
Open a design in the editor and the agent reshapes it around your schema — then render it from your own data over the API, or let your users edit it in the embedded editor.